In response to my recent calculation of my annual carbon footprint, I’ve been hunting for ways to offset my carbon emissions resulting from travel. The journey was initially confuddling and full of circles and dead ends, primarily because – unfortunately but completely to be expected – it’s hard to know whom to trust.
An article entitled “The complete guide to carbon offsetting” in The Guardian was my first grounding in some context for how all the different “schemes” fit into a broader context. I also gained some traction when I found many articles, including from the New York Times, that all mention certifying programs that will accredit offset programs as trustworthy and transparent.
I finally converged on the Quality Assurance Standard, developed by the UK Government in 2009 in order to solve the exact problem of figuring out whom to trust on offsets. The QAS certifies that companies and operations meet a 40-point standard, including being compliant with the Kyoto Protocol’s definition of what is a good offset.
Based on the QAS standard, I arrived at two possible avenues of responsible carbon offset: Clear, and Carbon Footprint. While it seems that cheaper offsets per ton of CO2 are available (outside the QAS certification), they may be questionable in their veracity and impact. Clear facilitates a more modular approach, allowing you to pick and choose different activities, such as a particular flight between cities or a commute, and offset its equivalent. Carbon Footprint seems easier to use if you already know the amount of carbon emissions in tons you want to offset, or want to use their tool to calculate it. Both seem mostly geared towards businesses, but allow individuals to offset their own emissions independently.
Since I already knew my total carbon footprint for the year and did not feel like manually reentering all the various inputs on Clear’s site, I went with Carbon Footprint, inputting the total amount for my 2019 air travel: 15 tons of CO2. I was offered various geographical project portfolios to offset the amount, ranging in cost from $122.55 for a “Global Portfolio” to $263.48 for a project based entirely in the UK (which would be domestic/local for this company, so that’s probably why it’s offered).
I chose the one called “Community Projects” for $163.40, based mostly on its additional humanitarian benefits: “Your funding supports a carefully selected range of projects from within developing countries that have strong additional benefits beyond reducing carbon emissions. These include health benefits, saving low-income families money and reducing deforestation. All projects in this portfolio are certified to the Gold Standard and include efficient household cook stoves and clean drinking water projects.” I then added $19.22 to the Global Portfolio for my two round trips to Sacramento in 2020 so far to visit family.
So… based on my estimated annual footprint, neutralizing my air travel brings me down to 37.5% below the US individual average carbon footprint, but alas still hanging out at 2.5x the global individual average. But that’s progress! Onward…
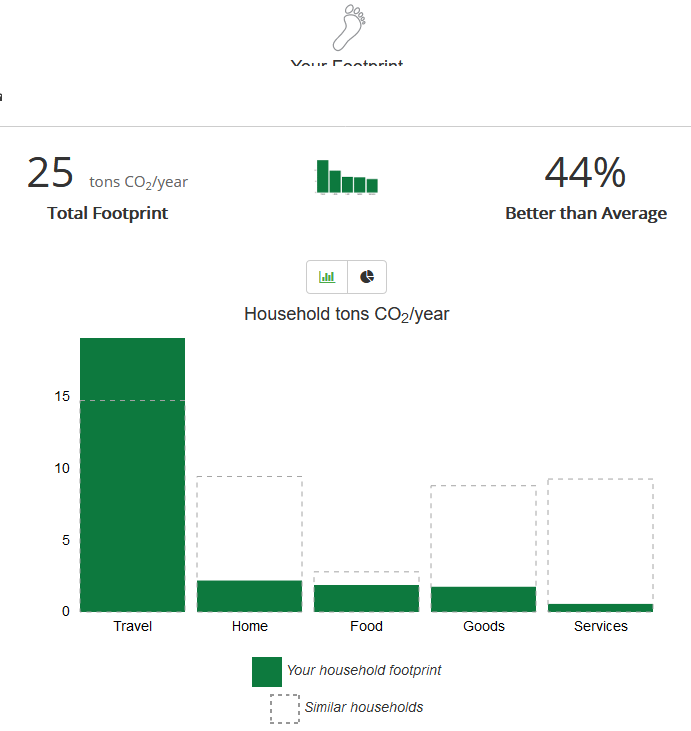
Despite how much I care about and base daily living decisions on thoughts about my climate impact, I realized that I have never once actually sat down and tabulated a detailed estimate of my carbon footprint. So I did.
The general results of the calculation was not surprising, but the sheer size of the contribution from travel shocked me. On the plus side though, it was also personally validating to see how some decisions I have made and stuck to are actually making a difference!
So I mean, you know, if I’m looking for a category in which I could make some improvement… just gotta somehow find one of these that stands out in some way I guess…
The details of my tabulation are below.
Step 1: Establish a Reference. The calculator asks for basic demographic information, including my zipcode (Hampton Roads area, Virginia), the number of people in my household (1), and my gross annual income (I’m a public employee… find me if you can!). These factors provide the statistical baseline for “normal” when comparing to “similar households”.
Step 2a: Transportation – Car. Since I don’t keep track year by year, I estimated my yearly car mileage by taking the total miles on my car (38,000) and dividing by the 3.5 years I’ve owned it to get about 10,850 miles per year. I drive a 2017 Toyota Camry Hybrid, which averages about 40 mpg overall. Note: I did not account for car travel due to work (say to DC or Wallops Island), since in most of these cases I’m given a rental car and I don’t keep track of that mileage, plus some of it is carpooled. I suppose I could ballpark that given known trips I took, but it’s honestly probably in the wash given my air travel…. speaking of which…
Step 2b: Transportation – Air Travel. Ouch. Here’s the category that really hit me! I used 2019 as the year for estimating, since I think it is more “typical” than 2020 for my air travel due to Covid. Since I didn’t have exact mileage, I estimated round-trip flight distances between origin/destination city pairs using an online tool, and then doubled it to account for the return leg. Note that this likely underestimates the total value by a decent amounbt… it doesn’t account for layovers/stops, rerouted flights, or cases where a flight loiters in a holding pattern at a busy airport or flies around weather, etc.
The above chart accounts for both personal and work air travel – a whopping 34,534 annual miles, generating 15 tons of CO2 emissions per year (about 60% of my total footprint). If I were to subtract out work travel (4 domestic trips), my personal air travel by itself (5 domestic trips and 1 international trip) was 21,368 miles, or roughly 6 tons/yr less than my total work + personal. (That alone would improve my relative score to 58% better than average for my income bracket + zip code.)
Step 3: Home Energy Use. I live in a 960 sqft apartment by myself. For the past 12 months (11/4/2019 – 11/2/2020) my energy bills show a total of 5665 kWh used. The calculator includes a slider for how much of your home energy use you offset, which helps me get that nice low result in this category: I offset 100% of my electricity usage through Dominion Energy’s voluntary Green Power program. (Note that customers can select a block option, so it doesn’t have to be all or nothing.) I should note that I don’t think that applying this offset to carbon-footprint directly is totally accurate, as Dominion’s website claims it sources the equivalent of my energy usage from “renewable sources” — which does not necessarily mean carbon-neutral sources. However, I think it’s safe to assume that this certainly a lot better than no offset at all.
Step 4: Nutrition. The “advanced” mode of the calculator allows you to dial in the average number of calories per day you consume from various sources. Thanks to my penchant for tracking my nutrition data on MyPlate over the last year as I simultaneously ramped up running training plans and shifted to a more plant-based diet, I have four separate week-long snapshots of everything I ate during those weeks, at different times of the year. Averaging those shows that the overall effect of a mostly-plant-based diet (I still eat fish and dairy) puts me at about a third below the average carbon footprint for Food.
Step 5: Shopping. This one seemed the most vague of the categories for me, since it basically consists just of two sliders, one each for “Goods” and “Services”, that represent the average dollar amount you spend on each category per month. I wish there were a way to differentiate between locally-sourced or used/up-cycled goods versus new goods shipped from afar; further, the estimate doesn’t differentiate between actually recyclable goods and Horrible Planet Death Plastic of Deception. But, that’s okay, it’s just a model I suppose! It does feel good to see how much below average my general consumption is.
I ran a report on the previous 12 months of my spending from my Quicken accounting software. In the “Goods” category I included everything in my Quicken category “Shopping”, which accounts for clothing, household purchases, etc (think Target, Home Depot, Costco, etc). It does not include Groceries, Auto/Gas, Rent, Insurance, etc. For “Services” I included my Quicken categories for Personal care + Health and Fitness + Education + Entertainment. Once I had the total for each over the last year, I divided by 12 to get an estimate of my average monthly expenditure.
The Covid effect… While 2020 may not be an entirely normal year in this respect, I don’t really buy much in terms of consumer goods and services (almost all of my consumer spending even in a normal year is on travel and dining, the effects of which are accounted for elsewhere), so I feel as though this is probably reasonably accurate.
Conclusions. While I’m pretty pleased about my performance on food, consumption, and home energy use, obviously there is a lot more I could be doing to either curb or offset my transportation emissions.
It would be easy to look at the overall number of “44% better than average” and forget that “average” means the average US consumer in my income bracket and zip code… who apparently generates a completely unsustainable 6.25x the global average individual carbon footprint. In other words, despite being a mostly vegetarian grumpy pseudo-hippie who doesn’t consume much, I’d need to reduce my footprint an additional 36% just to break even with the average American, or an additional 84% to break even with the the average human on Earth… and we need to go much lower together as a planet to have a chance at combating climate change.
This is a case where it is so useful to actually look at data… I have literally thought to myself that surely my green lifestyle more than makes up for my love of travel, perhaps at worst breaking even. Not so — counter to my intuition (wishful thinking?), despite a very eco-conscious lifestyle in every other respect, my travel footprint by itself completely overwhelms my green living.
Looking Ahead. It seems like an impossible target… but I’ve got some ideas. Created a new Category for Sustainability to blog my adventures in this domain. Stay tuned. In the meanwhile, I think I know what my New Year’s Resolution will be… anyone have any tips on where to look for verifiable, effective carbon offset programs for travel? Will report here on what I find…
Edit: Updated my conclusions to reflect more accurate (worse) comparison to US and Global average footprint. Eek.
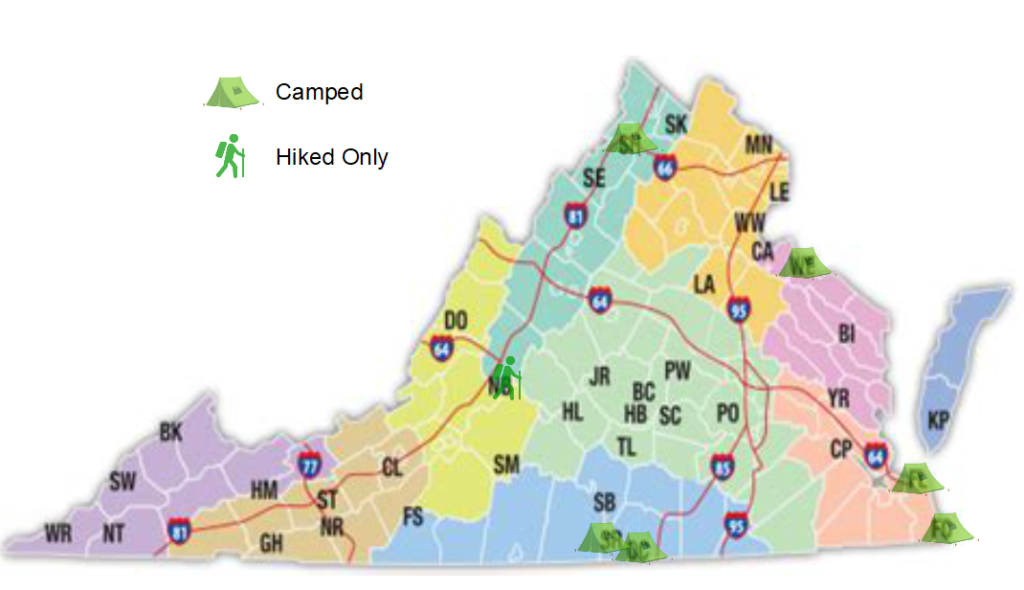
I’m starting a series to track my exploration of Virginia State Parks. Posts will be back-dated to when I actually went to the park, and I’ll add the respective photo album from the hikes, etc. I’ll also be keeping the image below up to date as possible!
I count myself extremely fortunate to have been spared any of the worst consequences of the covid-19 pandemic so far. Certainly, life has been pocked with inconveniences, but I’m grateful to have held onto the essentials (job, health, family, etc). I can even count among the things I’m grateful for in 2020 an unexpected silver lining: a re-connection with the Outdoors.
Thanks to adventurous parents, I started camping very young. I remember driving all around the rugged wild areas of Idaho, where I grew up, and the surrounding Northwest and Mountain West states to visit places of natural beauty in our pop-up tent trailer. High summer or deep mountain winter, my brother and I would dash off to find the perfect hiking stick (doubles as a spear against dragons, monsters, and bad guys) and explore the new terrain.
When I left Idaho for college in Arizona, the outdoors trips dropped off markedly. There were still a few family trips over summer vacation, and I remember taking a couple short car-camping one-nighters outside of Phoenix with dorm buddies, but generally far less outdoors time as I focused on getting a degree and the social life of an undergrad.
My first job out in the Mojave Desert of California included a resurgence of time spent outdoors, as I explored several National Parks within easy drive to my new location (including Yosemite, King’s Canyon, Sequoia, and Channel Islands… I later made it to Joshua Tree but still have yet to see Death Valley).
When I moved to Boston to teach, my outdoors time dropped off dramatically. I think this was a combination of the craziness of teaching, no longer having equipment (nor the discretionary income to buy new stuff), and a partner at the time who was not strongly into exploring nature and the outdoors. (We did make it up to New Hampshire for one camping trip, and also to Acadia National Park for a cabin stay.)
All three of the above constraints lifted when I transitioned back to engineering and moved to southern coastal Virginia, in the Hampton Roads area. It’s been wonderful to have such a variety of outdoorsy places within easy driving distance, from beach to forests to mountains! Shenandoah National Park, George Washington / Jefferson National Forests, and the numerous Virginia State Parks have been wonderful to explore.
The year 2020 has been a year of many trials for sure, but one of the main outcomes of this year that I’m grateful for has been the opportunity to rediscover the outdoors. When I could no longer travel internationally (or really, even domestically the way I used to), I moped for awhile… then re-baselined what I meant by “travel.”
Even with the resurgence, last year, I only managed three camping trips… this year I’ve camped 11 times! As a side benefit, it’s also rekindled my dormant interest in photography, which I will also try to share here. I’ll be back-dating several posts to document the trips.
2/14 – 2/17 Shenandoah River State Park
5/31 – 6/1 Occoneechee State Park
6/13 – 6/14 Staunton River State Park
7/11 – 7/12 Westmoreland State Park
7/17 – 7/18 False Cape State Park
7/25 – 7/26 Three Ridges Wilderness / Maupin Field
8/16 – 8/18 Redwoods National Park
9/11 – 9/13 Shenandoah National Park (Loft Mountain)
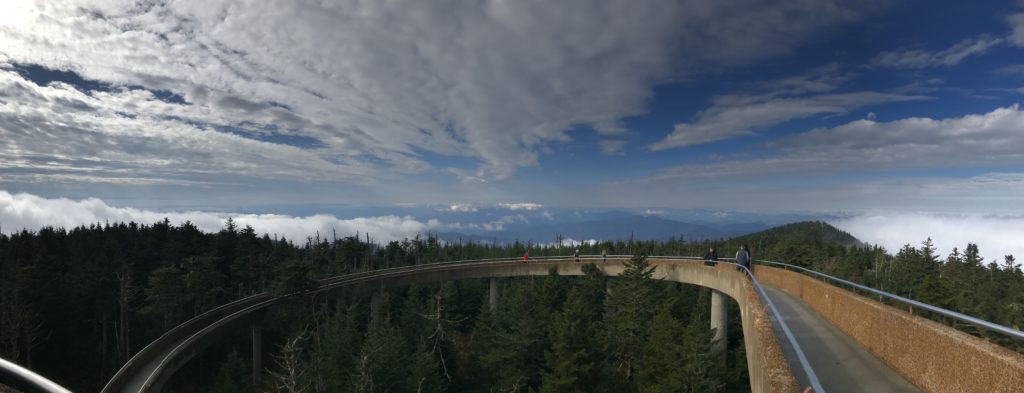
Friday 10/16 was our most physically demanding day in the park. Jason and I got an early start and headed up to Clingman’s Dome by road, the highest point in the park and in Tennessee. The road wound up to the higher elevations to the south of us, climbing into the morning fog and clouds that shrouded the mountain tops, with occasional pockets of clear skies and sunlight.
From the vantage point of the tower at the top of Clingman’s Dome, we had a 360-degree view of the surrounding mountain ranges.
Access ramp to the tower at the top of Clingman’s Dome.
After the beautiful morning on the dome, we set off from the parking area onto Forney Ridge Trail, descending gradually to the south, with ridgetop views towards both sides — Forney Creek valley and Suli Ridge to the west, and Mill Creek valley and Jerry Bald Ridge to the east.
We experienced many different sub-ecosystems on our hike — from misty pine forest to dry grass and ferns — as we hiked from Clingman’s Dome past Andrew’s Bald (lunch stop) and Buckhorn Bald down to Board Camp Gap, where we rested at the junction with the Spinghouse Brook Trail before starting the long climb back up to the highest point in the park.
[All photographs are copyright 2020 Nalin A. Ratnayake. They are free to use and share for any non-commercial purpose, with attribution and a link to the original post on naratnayake.com, without modification, and provided that this text is also included.]
Photos posted here were taken with a Canon EOS Rebel T1i and the EF 28-105mm 1/3.5-4.5 II USM lens. Images were compressed to 1/4 resolution and 85% image quality for easier upload and sharing. The panoramic and video were taken with an iPhone7.
On Thursday 10/15, Jason and I headed out for an “easy” day at Cades Cove, a low lying area in the northwest quadrant of the park. The geography is lower elevation (and thus with less fall foliage), with more open views over fields (including horses and wildlife!). A single-track paved road of bumper-to-bumper 15 mph traffic loops around the basin, connecting several historic sites and buildings that feature frontier mountain life in prior centuries.
Similar to the previous days’ experiences in the park, though the road itself was crowded, the sites themselves were less so as most people seemed to be content to view things from their cars. Further, once disembarked, even a half mile hike on a trail away from the parking area in one case led us to complete isolation for a quiet lunch.
After lunch we explored the Cable Mill site of an old (still working) grist mill, alongside several other historic buildings that had been relocated from other areas to create a small “village” of historic buildings.
We wrapped up our exploration of Cades Cove by taking Rich Mountain Road, a single-track dirt road through the mountains, out of the valley and into the town of Townsend, TN.
[All photographs are copyright 2020 Nalin A. Ratnayake. They are free to use and share for any non-commercial purpose, with attribution and a link to the original post on naratnayake.com, without modification, and provided that this text is also included.]
Photos posted here were taken with a Canon EOS Rebel T1i and the EF 28-105mm 1/3.5-4.5 II USM lens. Images were compressed to 1/4 resolution and 85% image quality for easier upload and sharing. The two photos of the grist mill were take with an iPhone7.
On Wednesday 10/14, along with my friends Jason and Mel, I hiked 2.7 miles on the Appalachian Trail from Newfound Gap to The Boulevard Trail, then another 2.5 miles (roughly) to Anakeesta Knob in the northeast quadrant of the park, before returning along the same route. (Due to a late start, we judged we did not have time to actually summit Mount Le Conte further along that trail.)
Although the large number of cars during peak hours at the major parking sites (including Newfound Gap) can make GSMNP appear to be a crowded park, our experience was that the crowds disappear quickly after about a mile or so away from the parking areas. Most people seem to be just day-tripping from Gatlinburg or the surrounding area, driving through, and stopping for roadside photos or a quick mini-hike. The AT is a little more crowded than other trails, but once off of it we dropped from seeing just a few people to almost no one.
There were some nice views along the way, but the real highlight of the hike was the moss! On a whim, we started trying to name and classify all the different kinds of moss we found. Knowing basically nothing about botany or moss, this meant we just named all the mosses we found based on what they looked like to us!
Found moss types included: microfern, tempurpedic, frosty moss, mossted tips, christmas tree, spiky moss, feather moss, happy little moss, star moss, tentacle moss, off-brand tempurpedic, midsummer night’s moss, and Bob Moss Himself.
[All photographs are copyright 2020 Nalin A. Ratnayake. They are free to use and share for any non-commercial purpose, with attribution and a link to the original post on naratnayake.com, without modification, and provided that this text is also included.]
Photos posted here were taken with a Canon EOS Rebel T1i and the EF 28-105mm 1/3.5-4.5 II USM lens. Images were compressed to 1/4 resolution and 85% image quality for easier upload and sharing.
Last week, I got to spend four full days (and parts of two more) in Great Smokey Mountains National Park. So beautiful! It wasn’t quite peak foliage, but we still got some amazing colors.
Having grown up in the West, I’ve always been biased towards the number and quality of the western national parks — and while I expect any national park to be beautiful, I have to admit that GSM was the first to really convince me that the East can be on the same level as the West in terms of natural beauty!
The broad extent of the mountains in all directions; the lush vegetation and seemingly endless forests starting to show their autumn color; the abundance of water — innumerable streams, rivers, cascades, and falls, along with the trademark fog and steamy morning mists; and the diversity of terrain all made the park level up from the expectation of “probably good” to a genuine “wow this is awesome.”
My friend Laura and I spent October 13th in the northwest quadrant of the park, starting with a 4.25-mile trail run on Jake’s Creek Trail (near our campsite in Elkmont Campground) and part of Meig’s Mountain Trail. After lunch, we hiked Meig’s Creek Trail near The Sinks, where we counted 20 stream crossings!
[All photographs are copyright 2020 Nalin A. Ratnayake. They are free to use and share for any non-commercial purpose, with attribution and a link to the original post on naratnayake.com, without modification, and provided that this text is also included.]
Photos posted here were taken with a Canon EOS Rebel T1i and the EF 28-105mm 1/3.5-4.5 II USM lens. Images were compressed to 1/4 resolution and 85% image quality for easier upload and sharing.
I had been signed up for the OBX Marathon, which was somehow still not coronacancelled… I think because it’s generally a smaller race (300 ish people in a typical year) perhaps they were banking on figuring something out… alas, no.
When I found out the race was going to be “virtual”, I immediately started thinking about options… three months into a four-month training plan, did I really want to maintain that level of work another month, for a virtual race?
I knew the experience (and my performance) would be compromised anyway. A virtual race, even if it is scoped out to the same distance, is missing the aid stations, the nutrition and hydration support every two miles, a closed and controlled course, and the psychological hype of a major event with tons of spectators and friends cheering you on…. it’s just not the same.
Further, training for a marathon has been a LOT of time… running five days a week and an additional day of light strength and yoga. I was looking at heading up to the Great Smokey Mountains next week, for example, worrying about maintaining a training plan while camping in the mountains. Doable, but not desirable.
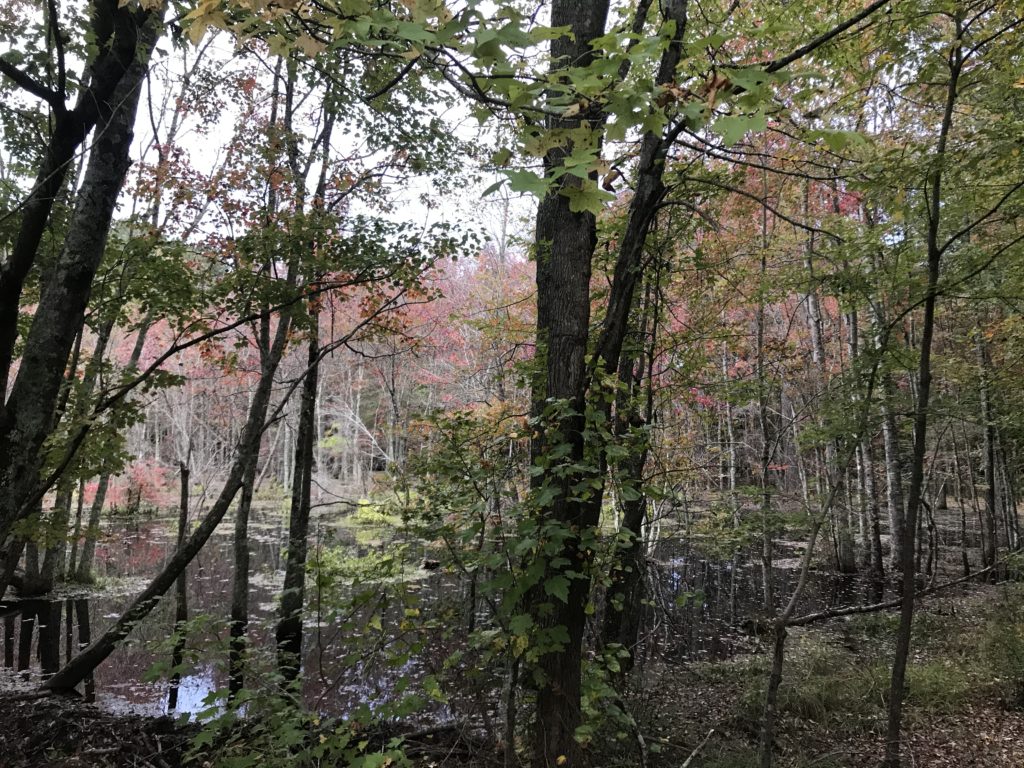
Early Autumn in the swamp! Taken from the Jamestown HS connector trail, just before it reaches the VCT proper.
In the end it was an easy decision: truncate the plan, forget any time goal, focus on recovery from the previous week, go simply for completion without injury, and look forward to the next time I can run a real race.
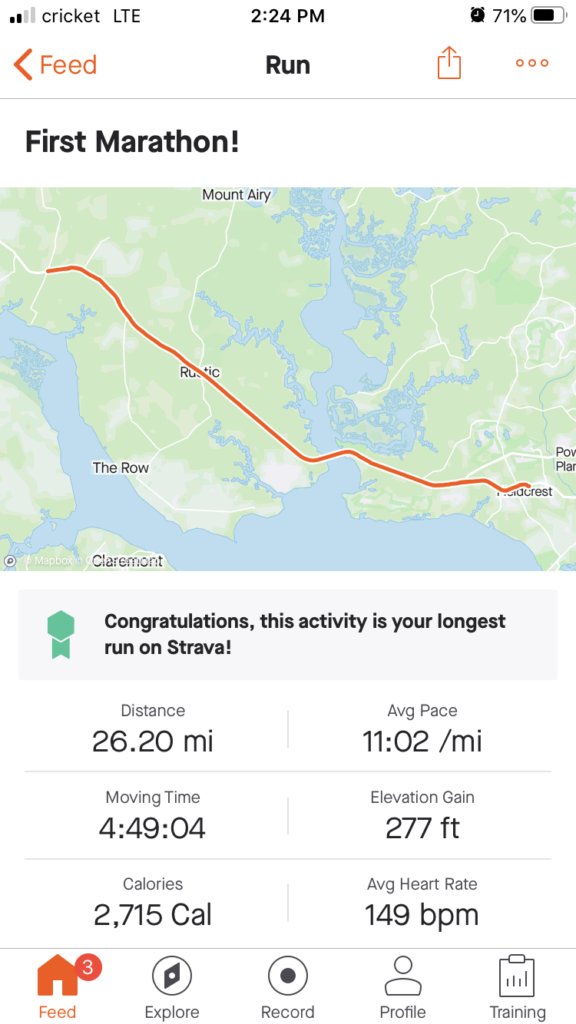
I ran 13.1 miles from Jamestown HS up the Virginia Capital Trail, where my friend Richard was parked, warmed-up, and ready to go. He resupplied me and we ran it back together to hit 26.2! For most of the way, it was a really pleasant run… nice fall weather and a light, cool rain sprinkling down to keep things refreshing and open up the scents of the forest.
My time of 4:49:04 includes all stretch, pee, hydration, and refuel stops. It’s slower than I had been originally aiming for, but again, goals were rescoped and I was also trying to be pretty conservative for the first 18 miles or so… Too many stories of first-time marathoners coming out too strong and bonking at 22!
Now that I’ve done one, I’m super pleased! It’s a big milestone in my running and now I have a baseline to build off of. Here’s hoping for real races in 2021…
Last post May of 2019? Probably because this site was focused on my writing, and I haven’t actively written fiction (or been involved with the scifi community) in a looooonnng time.
Some changes:
theme and appearance altered to emphasize the blog, and not my writing / author persona (though the Biblio page is still there if anyone’s interested)
new category added: Personal, with subcategories for outdoors and nature, DnD, running, and food — the pastimes that are actually where my time and energy go these days
phone app to quick post photos (may need to switch to a theme with post types to better accommodate photo-only posts)
This will all probably result in more posts! Probably. Maybe? We’ll see.